03
Dashboards and data
Raw answers say nothing. A dashboard you can open in a meeting says everything.
In short
- Languages
- Romanian, English
- Delivered so far
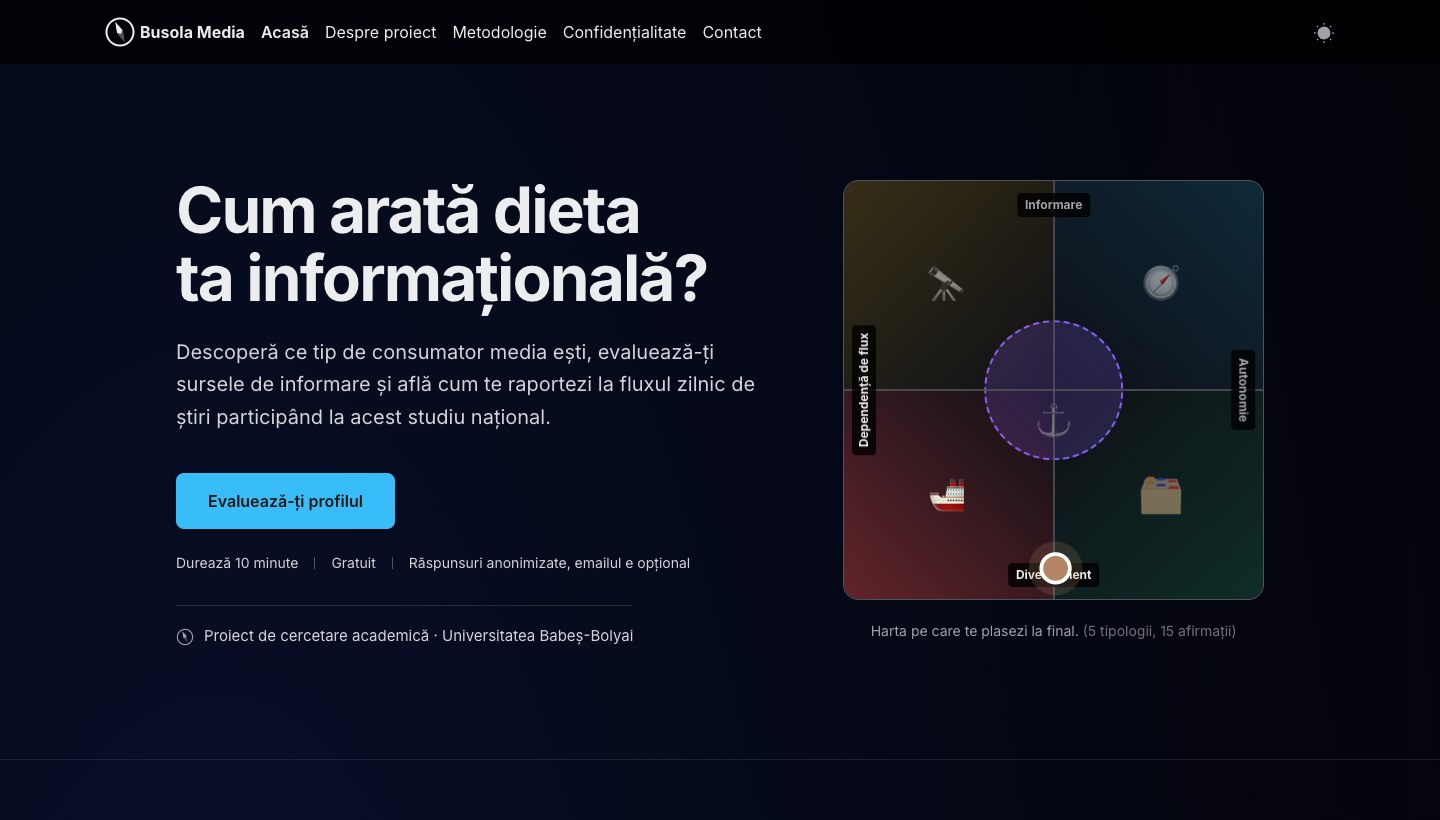
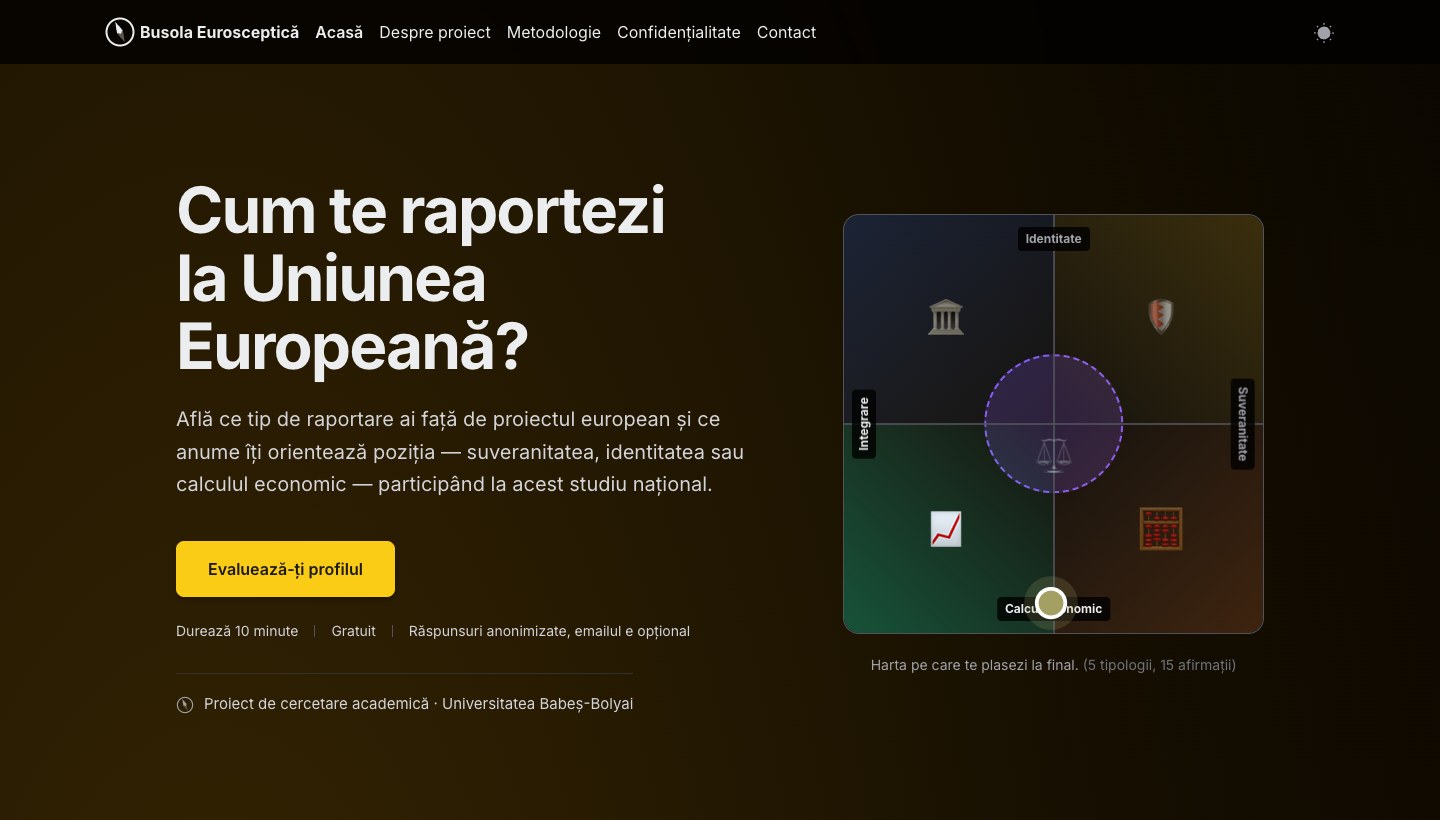
- 2 platforms
- Build
- In house, end to end
What it includes
01
Collection pipeline
Answers arrive structured from the start, not in a spreadsheet you repair next month.
02
Cleaning and weighting
Duplicates, joke entries, an unrepresentative sample. Handled before the first chart.
03
Live dashboard
Filters by demographic and by item, maps, segments, all updating in real time.
04
Export
CSV, XLSX or API. The dataset stays yours, in the format your team actually uses.
Tomorrow's chart and the dataset a year from now
A newsroom needs a number by five o’clock. A research team needs the whole clean set in six months. One collection, two demands — plan for only one and you serve neither well.
We build the pipeline so the answer is structured the moment it is given: every item with its type, every consent recorded separately. Over it go the representativeness indicators, so you know when you can publish a percentage and when you still need to recruit.
A percentage without a known sample is an opinion with decimal places.
Who it is for
Who asks us for a compass
Newsrooms
That want to publish a result today and defend it tomorrow.
Research teams
That want the whole set, documented, with no cleaning work.
Institutions
Reporting public consultations that need an audit trail.
Product teams
That want to see segments, not averages.
Compasses delivered